1.How to use Graphics and Charts.
You can use Microsoft PowerPoint 2010 to make and edit charts and graphs using data in Microsoft Excel 2010. There are two ways to add a chart or graph to a presentation:
- You can create a chart or graph in your presentation. When you create a chart in PowerPoint, the data for that chart is edited using Microsoft Excel 2010, but the data is saved with the PowerPoint file.
- You can paste an Excel chart or graph into your presentation and link to the data in an Excel file. When you copy a chart from a saved Excel file and paste it into your presentation, the data in the chart is linked to that Excel file. If you want to change the data in the chart, you must make your changes to the linked worksheet in Excel, and then refresh the data in your PowerPoint presentation. The Excel worksheet is a separate file and is not saved with the PowerPoint file.
Pasting a linked chart or graph is the easiest way to incorporate a chart built from an existing Excel workbook, or one with a large amount of data. For more information, see Insert a linked Excel chart in PowerPoint 2010
NOTE The following guidance assumes Microsoft Excel 2010 is installed on your computer. If Excel 2010 is not installed, a new data chart in PowerPoint is created using Microsoft Graph. In that case, some of the advanced data charting capabilities of Excel 2010 are not available.
Create a chart or graph in a presentation
To create a chart or graph in PowerPoint 2010, do the following:
- In PowerPoint, click the placeholder into which you want to insert a chart or graph.
- Do one of the following:
- On the Insert tab, in the Illustrations group, click Chart.

- In the placeholder, click Insert Chart
 .
.
- Click the chart or graph type that you want and click OK.
A Microsoft Excel worksheet with some sample data opens in a new window. To replace the sample data, click a cell on the worksheet and enter your data. You can also replace the sample axis labels in Column A and the legend entry name in Row 1. - When you have input all data that you want in the Excel worksheet, click the File tab and then click Close. The chart in PowerPoint is automatically updated with the new data.
You can modify the chart in PowerPoint, including changes to appearance, size or position. Click the chart, then on the green Chart Tools contextual tab, use the Design, Layout or Format tab to make changes. To add animation effects to the chart, use tools on the Animations tab.

You can change chart data in PowerPoint. Click the chart, then on the green Chart Tools contextual tab, on theDesign tab, click Edit Data. For more details, see Change the data in an existing chart.
2. How to Running Presentation
The whole point of a Microsoft PowerPoint presentation is to deliver a show to an audience. If that audience is in the same room with you, you can display your slide show onscreen.
Slide Show view is the view that you use when showing the presentation to others. One slide appears onscreen at a time, completely filling the screen. You may have used this view already — to check your work — while you were creating the presentation.
You can start Slide Show view from the first slide or from the current slide. The following table summarizes the methods of doing each.
| From First Slide | From Current Slide | |
|---|---|---|
| Shortcut key(s) | Press F5 | Press Shift+F5 |
| View tab | Slide Show→From Beginning | Slide Show→From Current Slide |
| View buttons (bottom right of screen) | N/A | Slide Show View button |
Then, after you’re in Slide Show view, you can show your presentation. Here’s how:
- Move to the next slide (in any of these ways):
- Click the mouse.
- Press any key on the keyboard (except Backspace or the left arrow).
- Right-click to display a shortcut menu and then choose Next.
- Move to the previous slide (in any of these ways):
- Press Backspace or the left arrow on the keyboard.
- Right-click to display a shortcut menu and choose Previous.
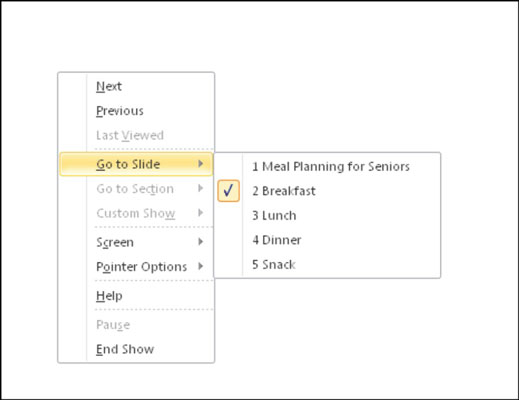
- Jump to a specific slide:
- a.Right-click to display a shortcut menu.
- b.Point to Go to Slide.
- c.Click the slide you want to display.

- End the show (in any of these ways):
- Click through to the end of the slide show (black screen) and then click one more time.
- Press the Esc key.
- Right-click to display a shortcut menu and then choose End Show.
conclusion
i have learn how to use design,animation and many more in microsoft powerpoint


No comments:
Post a Comment